Webinar Lessons Learned
1. About the Conceptual Framework of Haz-Map
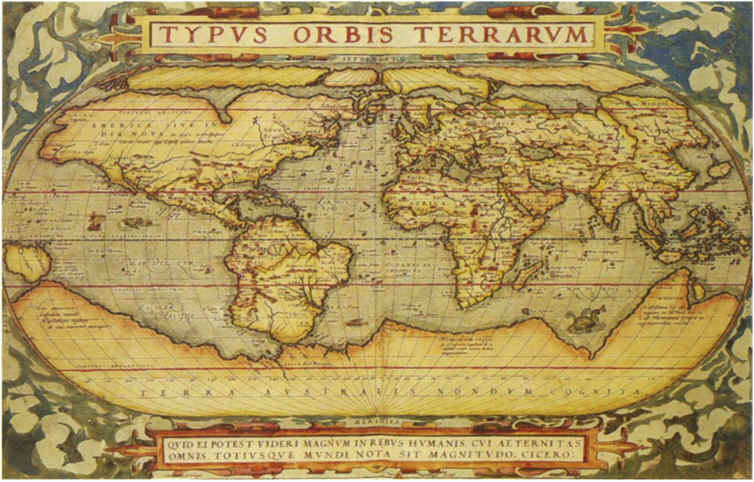
This world map was drawn by Flemish cartographer Abraham Ortelius in 1570. Today, satellites give us essentially complete knowledge of the earth’s surface so that we can zoom-in to see our houses. In 1570, a map of the world was needed even though information was limited. Today, we can map the knowledge domain of occupational toxicology realizing that knowledge is incomplete and accuracy will increase as we learn more.
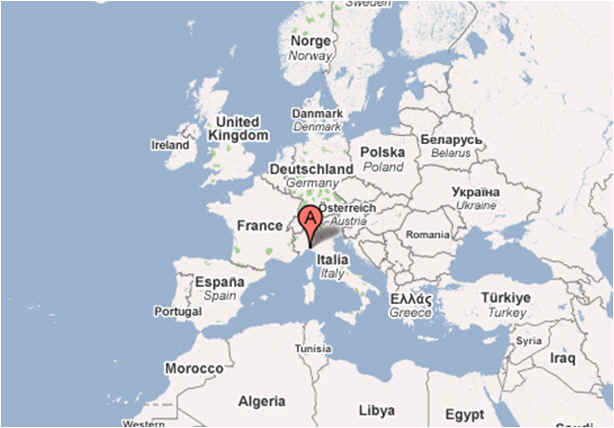
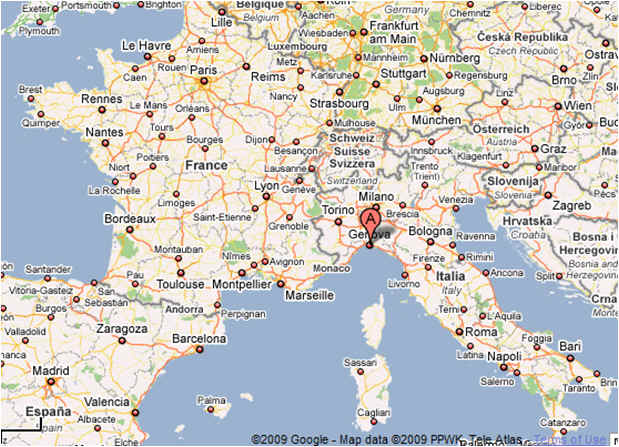
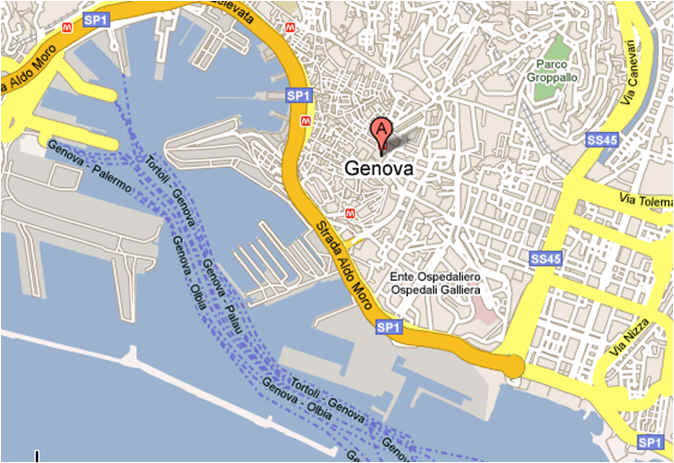
Zooming in and out of a Google map is similar to zooming in and out of toxicology information. There is the big picture, and there are the details that fit into the context of the big picture. “Information is data in context.”
2. About Occupational Cancer
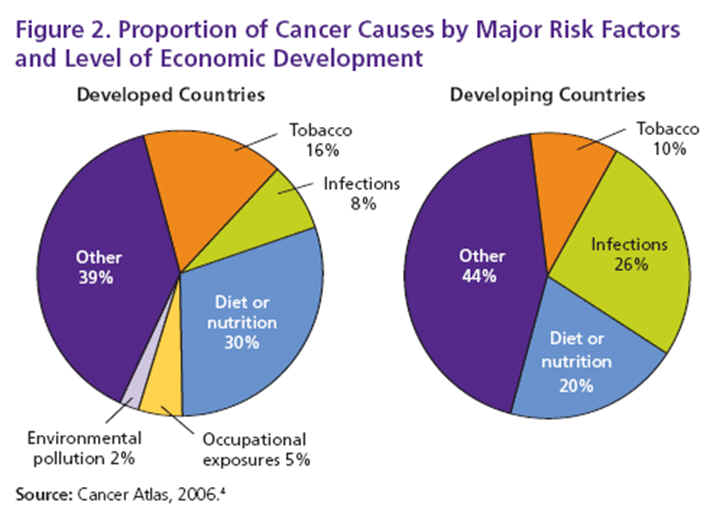
These statistics are from Cancer Atlas, 2006 published by the American Cancer Society, based on data from IARC, the International Agency for Research on Cancer.
3. About the Moral of the Story
The goal of preventing occupational diseases is attained by searching for scientific truth not by understating or overstating the risks. As stated by Goodman and Samet, "The notion of "causation" requires that the cause somehow actively "produce" its effect, which is captured operationally by the requirement that active manipulation of the cause should produce a change in the probability of the outcome." Knowing that cigarette smoking is the major cause of lung cancer and COPD means that we can now prevent the majority of cases of these diseases. The scientific method depends upon iteration "in which repetition of a sequence of operations yields results successively closer to a desired result." The desired result is the preventable cause of the occupational disease.
4. About Haz-Map Features of Which Users May Not Be Aware
a. You can search in Haz-Map by CAS number. Just type it in the search box at http://hazmap.nlm.nih.gov/ and click the Agent icon.
b. In the same seach box, type "class" and click the Agent icon. This will return all the Classes of chemicals in Haz-Map, for example, ACID ANHYDRIDES. All chemical classes are in ALL CAPS.
c. You can search for Haz-Map chemicals from ChemIDplus. Go to http://chem.sis.nlm.nih.gov/chemidplus/chemidlite.jsp and search for the chemical. If the chemical is in Haz-Map, then "Haz-Map" will appear in the list under the heading "File Locator."
d. Vapor pressure (VP) is a very important number in exposure assessment. The VPs in Haz-Map are room temperature (20-25 deg C) values. If you multiply the VP in mmHg times 1300, it will give you the saturated concentration in ppm. (The magic number is 1300 because 760 X 1300 = 1 million. If a chemical has a VP of 760 mmHg (1 atmosphere), then it has the potential to reach a concentration of 1 million parts per million in an enclosed space at room temperature. See Sullivan, p. 34.) ACGIH and AIHA are now publishing some chemical profiles that show values for saturated concentrations.
e. Just like shopping in a supermarket, being familiar with categories will help you to browse and find a specific item. The most important categories are:
Major Agent Categories at https://hazmap.nlm.nih.gov/types-of-agents
There are also subcategories of the major agent categories. Just click the major category to see the subcategories.
Process Categories at http://hazmap.nlm.nih.gov/cgi-bin/hazmap_custcgi?level=0&tree=Process
Disease Categories at https://hazmap.nlm.nih.gov/types-of-diseases
Job Task Categories at https://hazmap.nlm.nih.gov/types-of-job-tasks
5. About Making a Webinar Presentation
Check your phone with the equipment that will be used during your presentation. Have a backup phone ready. I called in using the Skype computer phone system. I had no problem talking with the moderator, but when the webinar started, all of my speech was echoed. The participants did not hear the echo, just me. It was very difficult to continue the presentation. I moved the earphones slightly away from my ears so the echo wasn't so loud. I interrupted the meeting twice to ask for assistance, but nothing could be done. I was able to finish the one hour presentation, but my concentration was broken by the constant echoing in the background.
[Home]
Revised: May 30, 2018